Data Visualization and Business Analytics Made Easy With Us
Get access to powerful BI tools and make informed business decisions faster. Try for FREE now!Benefits
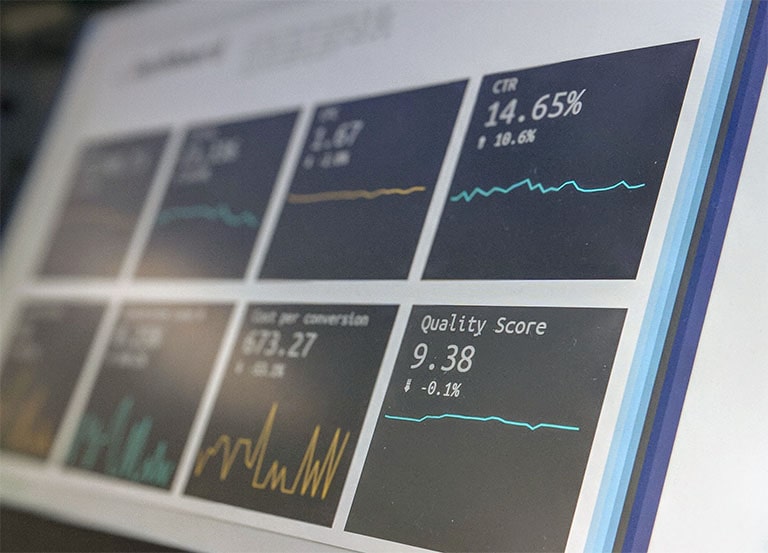
- Analyze and represent large datasets in interactive and intuitive dashboards, graphs, charts and other forms of visualizations.
- Get real-time access to actionable business data that helps in faster business decisions.Improve ROI with deeper and broader insight of your business data.
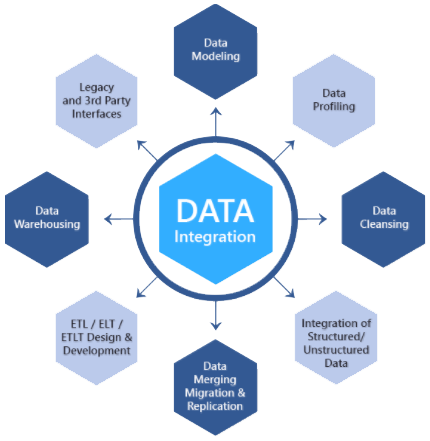
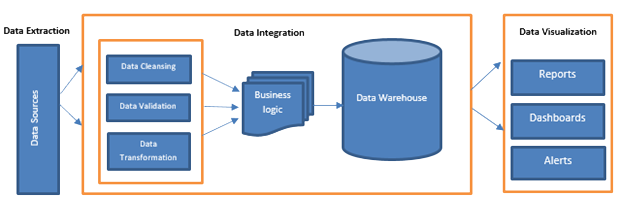
- Extract important data from various data sources (ERP, CRM, cloud, flat files) in any form and utilize them optimally.
Process
Why Choose Us?
- Top-notch business intelligence services with our team of highly experienced BI consultants and developers
- We analyze your entire business processes and provide tailored business solutions that fits perfectly with your business needs
- Deeper insights for faster real-time business decisions
- We thrive for 100% customer satisfaction. 90% of our business comes from repeat customers. That’s because our aim is to deliver seamless customer experience, every time!
- Delivery of 100+ projects providing end-to-end integrated solutions and application support.
- Dedicated industry practice area with large team of domain and technology experts
- Strategic partners with leading world class product companies to provide quickly implementable innovative IT solutions. Our partners are positioned in the “leaders” quadrant in the prestigious Gartner Magic Quadrant
- Efficient management of projects with hybrid delivery models and proficient methodologies like Agile
- Specialized competency in Digital technologies, Blockchain, BI & Analytics, mobility, UI/UX enabling organizational transformation to achieve competitive advantage
- Proprietary frameworks to enable quicker implementation adding value to the business
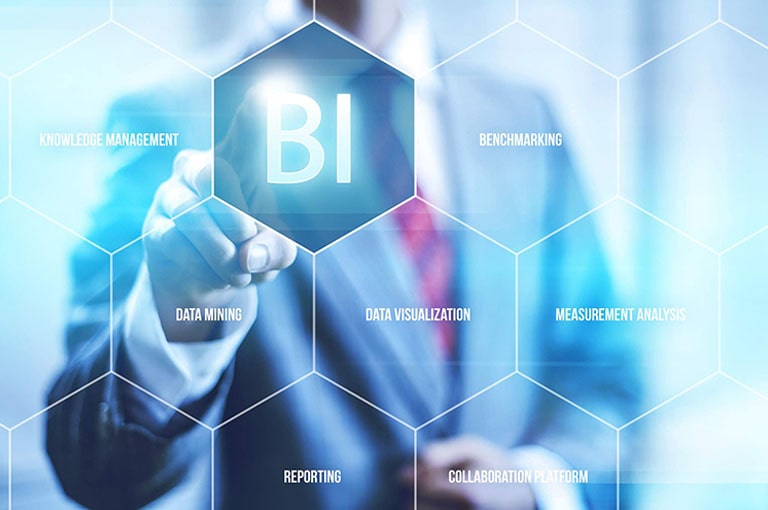
Benefits of BI
Improved Data Quality
More Accurate Reporting and Analysis
Faster Reporting,Analysis or Planning
Better Business Decisions
Improved Operational Process
Increased Competitive Advantage
HashCash BI services
Support for assessment and selection of the best Analytics & BI platforms

Process Consulting based on Best Practices

Implementation & Customizable integration Services

Training and end-to-end support Services
Use Cases
Business Process Improvement
Big data analytics help businesses to determine the actual state of their business providing a deeper view of how productive their business processes are. Analytics provides the raw facts, but once it is coupled with data visualization, it helps in filling the gaps where the business processes fall short.
Using data visualization, the process of recording a sale and further processing it for shipping can be easily tracked. The technology helps an organization understand what part of the process needs improvisation or corrective measure as well as see how it effects on its bottom line.
Healthcare
The best use case of this technology in healthcare industry is for patient diagnoses and treatment. The healthcare system stores patient information in different places in different formats, which results in difficult or impossible analysis of this data as a single cluster of information.
By using big data analytics, all structured and unstructured healthcare data can be gathered and placed on a single cluster for analysis by a BI tool. This improves healthcare professionals’ ability to determine patterns of treatment success by analyzing the holistic patient data and determining which treatments lead to the desired outcome.
Retail
The retail industry relies upon a deep insight of their markets and customers to gain competitive advantage. Big data analytics offer a strategic business value to retailers, by creating models to determine the success of a product based on predictive data points collected from huge volumes of unstructured data.
This data may include demographics of the existing customer base and the number of times the product is talked about within social media channels. Users are able to compare various sales trends with changing weather patterns or other parameters that may affect the sale of the product. The main focus is to provide retailers with all the relevant data to help them make critical business decisions.
Transport & Logistics
Transportation companies need to select the best and most profitable routes for optimal usage of vehicles and resources as well as maximize revenues in the business. Using Big Data analytics, they can predict the profitability of those routes by leveraging historical data visualized with key predictive metrics applied to data gathered from external sources.
Financial Services
Within the Financial Services industry, there are a number of compelling examples where powerful visualization techniques have been applied.
- 1 | Data Visualization and AML Detection
The prevention and detection of money laundering remains a key focus across financial services. As lawbreakers are coming up with new and complex ways to fund illegal activities, more and more financial institutions are applying multiple visualization techniques for real-time discovery of fraudulent activities.
Purpose: Prevention and detection of money laundering
Users: 1. Head of Compliance 2. Compliance Team
Requirement: Visualization detects suspicious activities, maps entities and networks across the organization and identifies abnormalities instantaneously.
- 2 | Data Visualization and Data Lineage
Being able to map data lineage across the enterprise is a serious data governance component for any enterprise. Regular technology advancements and growing regulatory pressures make it mandatory that institutional data is tracked efficiently and networks are managed around these datasets. Applying the right visualization technique allows enterprises to track data end-to-end and identify consumption pattern across the enterprise.
Purpose: To understand data lineage and dependencies across institutions technology landscape.
Users: 1. Chief Data Officers 2. Data Teams & Architects 3. Business Owners 4. System Owners
Solution: Visualization highlights data lineage across the value chain from origination to consumption instantaneously.
- 3 | Data Visualization and Liquidity Risk Reporting
Liquidity Risk reporting should be prompt and precise but most often they are not due to inaccurate data obtained from a number of data sources. Combining machine learning with powerful data visualization allows banks or FIs to find valuable insights on primary data and use it optimally for processing.
Purpose: To obtain a prompt overview of the risk levels and to provide intelligent predictions.
Users: 1. Risk management 2. Liquidity 3. Compliance
Solution: Data visualization is able to perform back test approximations based on internal data, recognize behavioural patterns and segregate the clients by various parameters like industry sector, geography, concentration levels etc.
- 4 | Sales Analytics – Cross-selling
Financial institutions have a substantial amount of data related to existing and potential customers. By coupling data science and specific visualization techniques, FIs are able to intelligently cross-sell to existing clients and boost their success rate of client conversion.
Purpose: Visualize customer and transaction data trends for targeted sales, marketing and account management.
Users: 1. HR 2. Sales Team 3. Account Management 4. Marketing
Solution: The visualization supported by internal and external data allows for a personalized dashboard, tailored messaging, and smart targeting based on behavior.
- 5 | Alpha Identification – Social Media Optimization
In this use case, data visualization is being used to show the outputs of social media sentiment analysis based on live twitter feeds for specific stock tickers. The hypothesis considered that this sentiment contains actionable alpha.
Purpose: Visualize customer sentiment and transaction data trends for focused sales, marketing and key account management campaigns.
Users: 1. Sales & Trading 2. Financial Services Trading Technology vendors 3. Portfolio Managers
Solution: The visualization is real time, sorting the outputs into positive vs. negative sentiment that are plotted over time.
Our Partners
We partner with the established leaders and innovators in the data visualization field
As Tableau’s Alliance partners, HashCash helps its customers to implement Tableau and leverage their diverse backgrounds to help them find the right BI solution.
HashCash has partnered with Tableau to provide their clients with a compelling alternative solution to traditional BI. We help our customers select best-in-class BI applications and analytics tools. As a certified partner, HashCash helps you leverage Tableau to transform your data into actionable insights and discover trends that are relevant to your business.
HashCash leverages Tableau Software platform to deliver powerful business analytics solutions in a variety of industries including financial services, banking and manufacturing.
Tableau Software helps people see and understand data. Tableau is offering a revolutionary approach to business intelligence. It allows our customers to connect, visualize, and share data with a seamless experience from one device to the other.
Create and publish dashboards easily. Share them with your peers, partners or customers without any programming skills.
As a System Integrator Partner for QlikSense, HashCash helps with purchase, implementation, or support of Qlik products and with best-in-class services in data integration, user-driven business intelligence and conversational analytics.
HashCash is an authorized partner of Microsoft Power BI offering a full array of BI consulting services that help our customers make informed business decisions. Our team is well-equipped to handle any analytical challenges be it advanced analytics, reporting, or dashboarding.